#How to learn Excel for Data Analyst
Explore tagged Tumblr posts
Visit Tumblr Blog
Explore Tumblr blogs with no restrictions, modern design and the best experience.
Last Seen Tumblr Blogs


Fun Fact
There are dozens of funny blogs to kill time on Tumblr.
Text
How to Learn Excel for Data Analysis: A Step-by-Step Guide

In today’s data-driven world, Excel remains one of the most powerful and accessible tools for analyzing data. Whether you’re a student, professional, or business owner, learning Excel for data analysis training can boost your productivity and help you make smarter decisions. The great news? You don’t need to be a tech expert to get started — with the right approach, anyone can master Excel’s core features.
This guide will walk you through the essential steps to learn Excel for data analysis, from basic functions to advanced tools like PivotTables. Along the way, I’ll share practical tips and examples so you can apply what you learn immediately.
Step 1: Get Access to Excel or a Suitable Alternative
Before you dive into learning Excel, make sure you have access to the software. Microsoft Excel is available as part of the Microsoft Office suite or through a Microsoft 365 subscription.
If you don’t want to invest right away, consider free alternatives like Google Sheets or LibreOffice Calc. Google Sheets, for example, offers many similar features and is cloud-based, allowing you to work from anywhere.
Just keep in mind that some advanced Excel features might not be available on all platforms, so choose based on your long-term needs.
Step 2: Familiarize Yourself with the Excel Interface
Open Excel and take some time to explore its interface. Understanding the layout will save you a lot of frustration later on.
You’ll notice the ribbon at the top with tabs like Home, Insert, Formulas, and Data. These tabs group related tools and commands. Get comfortable navigating between them.
Learn the basic Excel terminology too: cells are individual boxes where you input data; rows run horizontally and are numbered; columns run vertically and are labeled with letters. A worksheet is a single spreadsheet tab, and a workbook is the entire Excel file containing one or more worksheets.
Step 3: Master Basic Excel Functions
Start with simple functions that form the foundation of data analysis. Functions like SUM (to add numbers), AVERAGE (to find the mean), COUNT (to count entries), and MAX/MIN (to find the largest and smallest values) are essential.
Try applying these functions on a small dataset, such as a list of monthly sales figures, to calculate totals and averages quickly.
You’ll also want to understand how to use cell references in formulas. For example, typing =A1+B1 adds the values in cells A1 and B1. Knowing how to use relative and absolute references will help when you copy formulas across rows and columns.
Step 4: Learn Data Entry and Formatting
Entering data correctly is crucial for analysis. Be mindful of the data types you use: numbers, text, dates, and currency formats all behave differently in Excel.
Spend time formatting your spreadsheets to improve readability. Use bold fonts, colors, borders, and cell shading strategically. Formatting doesn’t just make your data look nice — it helps highlight important information and avoids confusion.
Step 5: Clean and Prepare Your Data
Real-world data is often messy. You might encounter missing values, duplicate rows, or inconsistent entries. Excel has several built-in tools to help clean and prepare data before analysis.
For instance, you can use Data Validation to restrict what type of data can be entered into a cell, helping prevent errors. The Text to Columns feature lets you split a single column of data into multiple columns — useful when you have combined fields like full names or addresses.
Remove duplicates easily with the Remove Duplicates tool, and learn how to filter or sort data to find anomalies.
Step 6: Create Basic Data Visualizations
Visualizing your data helps you and others understand trends and patterns quickly. Start by creating simple charts like bar charts, line graphs, and pie charts.
Select your data, then go to the Insert tab and pick the chart type that fits your story. Customize your chart by adding clear titles, axis labels, and data labels. For example, a sales bar chart with monthly totals and labels is much easier to interpret than a raw table of numbers.
Step 7: Explore Advanced Functions and Formulas
Once you’re comfortable with basics, move on to more powerful Excel functions that enhance data analysis.
Functions like VLOOKUP and HLOOKUP let you search for values across tables — essential for combining datasets. INDEX and MATCH are advanced lookup functions that give you more flexibility than VLOOKUP.
Logical functions like IF, AND, and OR allow you to build conditional formulas, such as “If sales are above target, mark as ‘Good’, else ‘Needs Improvement’.” CONCATENATE helps combine text from multiple cells, and TEXT lets you format numbers and dates creatively.
Excel also provides formula auditing tools, so you can trace and troubleshoot complex formulas step-by-step, reducing errors.
Step 8: Harness the Power of PivotTables
PivotTables are one of Excel’s most powerful features for data analysis. They let you summarize large datasets quickly without writing complicated formulas.
Creating a PivotTable involves dragging and dropping fields into rows, columns, and values areas to dynamically explore your data. For example, you can analyze sales by region and product category within seconds.
PivotTables also support filtering and grouping, allowing you to drill down into specific segments or time periods easily.
Quick Tips to Boost Your Excel Learning Journey
Practice regularly by working on real datasets, such as your personal budget or sample sales data. Hands-on experience solidifies learning.
Use free online tutorials and courses from platforms like YouTube, Coursera, or LinkedIn Learning for structured guidance.
Join Excel user communities or forums like Reddit’s r/excel to ask questions and share knowledge.
Build a small project portfolio — maybe analyze your favorite sports stats or track your fitness data — to showcase your skills.
Keep exploring new features as Excel updates frequently, introducing more automation and AI-powered tools.
Conclusion
Learning Excel for data analysis is a valuable skill that opens up many career opportunities and helps you make data-driven decisions in everyday life. Start with the basics, practice regularly, and gradually explore more advanced tools like PivotTables and complex formulas.
Remember, the best way to master Excel is by doing. Don’t hesitate to experiment with your own data and projects. With patience and practice, you’ll soon unlock the full power of Excel and become confident in analyzing any dataset.
Ready to dive in? Open Excel today and take your first steps toward becoming a data-savvy professional!
0 notes
Text
You know how corporations make you create your personal development plans (PDPs) where you gotta specify what you wanna learn this year, how you gonna learn it, the time frame for learning it, measures of success etc.? (Yay me for putting in Power Pivot and statistical methods in this year’s plan, fml right? #dataaanalystlife*)
Anyway, my truly *personal* PDP for 2025 is to learn to make awesome gifs and become a prime McGregor blog. I dare say it is WAY more important than whatever corporate hell I find myself in. (JK, I love my job bc I love MS Excel and Power Query)
*I became a data analyst because you can find anal in it. Duh.
9 notes
·
View notes
Text
Python Programming Language: A Comprehensive Guide
Python is one of the maximum widely used and hastily growing programming languages within the world. Known for its simplicity, versatility, and great ecosystem, Python has become the cross-to desire for beginners, professionals, and organizations across industries.
What is Python used for

🐍 What is Python?
Python is a excessive-stage, interpreted, fashionable-purpose programming language. The language emphasizes clarity, concise syntax, and code simplicity, making it an excellent device for the whole lot from web development to synthetic intelligence.
Its syntax is designed to be readable and easy, regularly described as being near the English language. This ease of information has led Python to be adopted no longer simplest through programmers but also by way of scientists, mathematicians, and analysts who may not have a formal heritage in software engineering.
📜 Brief History of Python
Late Nineteen Eighties: Guido van Rossum starts work on Python as a hobby task.
1991: Python zero.9.0 is released, presenting classes, functions, and exception managing.
2000: Python 2.Zero is launched, introducing capabilities like list comprehensions and rubbish collection.
2008: Python 3.Zero is launched with considerable upgrades but breaks backward compatibility.
2024: Python three.12 is the modern day strong model, enhancing performance and typing support.
⭐ Key Features of Python
Easy to Learn and Use:
Python's syntax is simple and similar to English, making it a high-quality first programming language.
Interpreted Language:
Python isn't always compiled into device code; it's far done line by using line the usage of an interpreter, which makes debugging less complicated.
Cross-Platform:
Python code runs on Windows, macOS, Linux, and even cell devices and embedded structures.
Dynamic Typing:
Variables don’t require explicit type declarations; types are decided at runtime.
Object-Oriented and Functional:
Python helps each item-orientated programming (OOP) and practical programming paradigms.
Extensive Standard Library:
Python includes a rich set of built-in modules for string operations, report I/O, databases, networking, and more.
Huge Ecosystem of Libraries:
From data technological know-how to net development, Python's atmosphere consists of thousands of programs like NumPy, pandas, TensorFlow, Flask, Django, and many greater.
📌 Basic Python Syntax
Here's an instance of a easy Python program:
python
Copy
Edit
def greet(call):
print(f"Hello, call!")
greet("Alice")
Output:
Copy
Edit
Hello, Alice!
Key Syntax Elements:
Indentation is used to define blocks (no curly braces like in different languages).
Variables are declared via task: x = 5
Comments use #:
# This is a remark
Print Function:
print("Hello")
📊 Python Data Types
Python has several built-in data kinds:
Numeric: int, go with the flow, complicated
Text: str
Boolean: bool (True, False)
Sequence: listing, tuple, range
Mapping: dict
Set Types: set, frozenset
Example:
python
Copy
Edit
age = 25 # int
name = "John" # str
top = 5.Nine # drift
is_student = True # bool
colors = ["red", "green", "blue"] # listing
🔁 Control Structures
Conditional Statements:
python
Copy
Edit
if age > 18:
print("Adult")
elif age == 18:
print("Just became an person")
else:
print("Minor")
Loops:
python
Copy
Edit
for color in hues:
print(coloration)
while age < 30:
age += 1
🔧 Functions and Modules
Defining a Function:
python
Copy
Edit
def upload(a, b):
return a + b
Importing a Module:
python
Copy
Edit
import math
print(math.Sqrt(sixteen)) # Output: four.0
🗂️ Object-Oriented Programming (OOP)
Python supports OOP functions such as lessons, inheritance, and encapsulation.
Python
Copy
Edit
elegance Animal:
def __init__(self, call):
self.Call = name
def communicate(self):
print(f"self.Call makes a valid")
dog = Animal("Dog")
dog.Speak() # Output: Dog makes a legitimate
🧠 Applications of Python
Python is used in nearly each area of era:
1. Web Development
Frameworks like Django, Flask, and FastAPI make Python fantastic for building scalable web programs.
2. Data Science & Analytics
Libraries like pandas, NumPy, and Matplotlib permit for data manipulation, evaluation, and visualization.
Three. Machine Learning & AI
Python is the dominant language for AI, way to TensorFlow, PyTorch, scikit-research, and Keras.
4. Automation & Scripting
Python is extensively used for automating tasks like file managing, device tracking, and data scraping.
Five. Game Development
Frameworks like Pygame allow builders to build simple 2D games.
6. Desktop Applications
With libraries like Tkinter and PyQt, Python may be used to create cross-platform computing device apps.
7. Cybersecurity
Python is often used to write security equipment, penetration trying out scripts, and make the most development.
📚 Popular Python Libraries
NumPy: Numerical computing
pandas: Data analysis
Matplotlib / Seaborn: Visualization
scikit-study: Machine mastering
BeautifulSoup / Scrapy: Web scraping
Flask / Django: Web frameworks
OpenCV: Image processing
PyTorch / TensorFlow: Deep mastering
SQLAlchemy: Database ORM
💻 Python Tools and IDEs
Popular environments and tools for writing Python code encompass:
PyCharm: Full-featured Python IDE.
VS Code: Lightweight and extensible editor.
Jupyter Notebook: Interactive environment for statistics technological know-how and studies.
IDLE: Python’s default editor.
🔐 Strengths of Python
Easy to study and write
Large community and wealthy documentation
Extensive 0.33-birthday celebration libraries
Strong support for clinical computing and AI
Cross-platform compatibility
⚠️ Limitations of Python
Slower than compiled languages like C/C++
Not perfect for mobile app improvement
High memory usage in massive-scale packages
GIL (Global Interpreter Lock) restricts genuine multithreading in CPython
🧭 Learning Path for Python Beginners
Learn variables, facts types, and control glide.
Practice features and loops.
Understand modules and report coping with.
Explore OOP concepts.
Work on small initiatives (e.G., calculator, to-do app).
Dive into unique areas like statistics technological know-how, automation, or web development.
#What is Python used for#college students learn python#online course python#offline python course institute#python jobs in information technology
2 notes
·
View notes
Text
Business Analytics vs. Data Science: Understanding the Key Differences

In today's data-driven world, terms like "business analytics" and "data science" are often used interchangeably. However, while they share a common goal of extracting insights from data, they are distinct fields with different focuses and methodologies. Let's break down the key differences to help you understand which path might be right for you.
Business Analytics: Focusing on the Present and Past
Business analytics primarily focuses on analyzing historical data to understand past performance and inform current business decisions. It aims to answer questions like:
What happened?
Why did it happen?
What is happening now?
Key characteristics of business analytics:
Descriptive and Diagnostic: It uses techniques like reporting, dashboards, and data visualization to summarize and explain past trends.
Structured Data: It often works with structured data from databases and spreadsheets.
Business Domain Expertise: A strong understanding of the specific business domain is crucial.
Tools: Business analysts typically use tools like Excel, SQL, Tableau, and Power BI.
Focus: Optimizing current business operations and improving efficiency.
Data Science: Predicting the Future and Building Models
Data science, on the other hand, focuses on building predictive models and developing algorithms to forecast future outcomes. It aims to answer questions like:
What will happen?
How can we make it happen?
Key characteristics of data science:
Predictive and Prescriptive: It uses machine learning, statistical modeling, and AI to predict future trends and prescribe optimal actions.
Unstructured and Structured Data: It can handle both structured and unstructured data from various sources.
Technical Proficiency: Strong programming skills (Python, R) and a deep understanding of machine learning algorithms are essential.
Tools: Data scientists use programming languages, machine learning libraries, and big data technologies.
Focus: Developing innovative solutions, building AI-powered products, and driving long-term strategic initiatives.
Key Differences Summarized:

Which Path is Right for You?
Choose Business Analytics if:
You are interested in analyzing past data to improve current business operations.
You have a strong understanding of a specific business domain.
You prefer working with structured data and using visualization tools.
Choose Data Science if:
You are passionate about building predictive models and developing AI-powered solutions.
You have a strong interest in programming and machine learning.
You enjoy working with both structured and unstructured data.
Xaltius Academy's Data Science & AI Course:
If you're leaning towards data science and want to delve into machine learning and AI, Xaltius Academy's Data Science & AI course is an excellent choice. This program equips you with the necessary skills and knowledge to become a proficient data scientist, covering essential topics like:
Python programming
Machine learning algorithms
Data visualization
And much more!
By understanding the distinct roles of business analytics and data science, you can make an informed decision about your career path and leverage the power of data to drive success.
2 notes
·
View notes
Text
Why Tableau is Essential in Data Science: Transforming Raw Data into Insights

Data science is all about turning raw data into valuable insights. But numbers and statistics alone don’t tell the full story—they need to be visualized to make sense. That’s where Tableau comes in.
Tableau is a powerful tool that helps data scientists, analysts, and businesses see and understand data better. It simplifies complex datasets, making them interactive and easy to interpret. But with so many tools available, why is Tableau a must-have for data science? Let’s explore.
1. The Importance of Data Visualization in Data Science
Imagine you’re working with millions of data points from customer purchases, social media interactions, or financial transactions. Analyzing raw numbers manually would be overwhelming.
That’s why visualization is crucial in data science:
Identifies trends and patterns – Instead of sifting through spreadsheets, you can quickly spot trends in a visual format.
Makes complex data understandable – Graphs, heatmaps, and dashboards simplify the interpretation of large datasets.
Enhances decision-making – Stakeholders can easily grasp insights and make data-driven decisions faster.
Saves time and effort – Instead of writing lengthy reports, an interactive dashboard tells the story in seconds.
Without tools like Tableau, data science would be limited to experts who can code and run statistical models. With Tableau, insights become accessible to everyone—from data scientists to business executives.
2. Why Tableau Stands Out in Data Science
A. User-Friendly and Requires No Coding
One of the biggest advantages of Tableau is its drag-and-drop interface. Unlike Python or R, which require programming skills, Tableau allows users to create visualizations without writing a single line of code.
Even if you’re a beginner, you can:
✅ Upload data from multiple sources
✅ Create interactive dashboards in minutes
✅ Share insights with teams easily
This no-code approach makes Tableau ideal for both technical and non-technical professionals in data science.
B. Handles Large Datasets Efficiently
Data scientists often work with massive datasets—whether it’s financial transactions, customer behavior, or healthcare records. Traditional tools like Excel struggle with large volumes of data.
Tableau, on the other hand:
Can process millions of rows without slowing down
Optimizes performance using advanced data engine technology
Supports real-time data streaming for up-to-date analysis
This makes it a go-to tool for businesses that need fast, data-driven insights.
C. Connects with Multiple Data Sources
A major challenge in data science is bringing together data from different platforms. Tableau seamlessly integrates with a variety of sources, including:
Databases: MySQL, PostgreSQL, Microsoft SQL Server
Cloud platforms: AWS, Google BigQuery, Snowflake
Spreadsheets and APIs: Excel, Google Sheets, web-based data sources
This flexibility allows data scientists to combine datasets from multiple sources without needing complex SQL queries or scripts.
D. Real-Time Data Analysis
Industries like finance, healthcare, and e-commerce rely on real-time data to make quick decisions. Tableau’s live data connection allows users to:
Track stock market trends as they happen
Monitor website traffic and customer interactions in real time
Detect fraudulent transactions instantly
Instead of waiting for reports to be generated manually, Tableau delivers insights as events unfold.
E. Advanced Analytics Without Complexity
While Tableau is known for its visualizations, it also supports advanced analytics. You can:
Forecast trends based on historical data
Perform clustering and segmentation to identify patterns
Integrate with Python and R for machine learning and predictive modeling
This means data scientists can combine deep analytics with intuitive visualization, making Tableau a versatile tool.
3. How Tableau Helps Data Scientists in Real Life
Tableau has been adopted by the majority of industries to make data science more impactful and accessible. This is applied in the following real-life scenarios:
A. Analytics for Health Care
Tableau is deployed by hospitals and research institutions for the following purposes:
Monitor patient recovery rates and predict outbreaks of diseases
Analyze hospital occupancy and resource allocation
Identify trends in patient demographics and treatment results
B. Finance and Banking
Banks and investment firms rely on Tableau for the following purposes:
✅ Detect fraud by analyzing transaction patterns
✅ Track stock market fluctuations and make informed investment decisions
✅ Assess credit risk and loan performance
C. Marketing and Customer Insights
Companies use Tableau to:
✅ Track customer buying behavior and personalize recommendations
✅ Analyze social media engagement and campaign effectiveness
✅ Optimize ad spend by identifying high-performing channels
D. Retail and Supply Chain Management
Retailers leverage Tableau to:
✅ Forecast product demand and adjust inventory levels
✅ Identify regional sales trends and adjust marketing strategies
✅ Optimize supply chain logistics and reduce delivery delays
These applications show why Tableau is a must-have for data-driven decision-making.
4. Tableau vs. Other Data Visualization Tools
There are many visualization tools available, but Tableau consistently ranks as one of the best. Here’s why:
Tableau vs. Excel – Excel struggles with big data and lacks interactivity; Tableau handles large datasets effortlessly.
Tableau vs. Power BI – Power BI is great for Microsoft users, but Tableau offers more flexibility across different data sources.
Tableau vs. Python (Matplotlib, Seaborn) – Python libraries require coding skills, while Tableau simplifies visualization for all users.
This makes Tableau the go-to tool for both beginners and experienced professionals in data science.
5. Conclusion
Tableau has become an essential tool in data science because it simplifies data visualization, handles large datasets, and integrates seamlessly with various data sources. It enables professionals to analyze, interpret, and present data interactively, making insights accessible to everyone—from data scientists to business leaders.
If you’re looking to build a strong foundation in data science, learning Tableau is a smart career move. Many data science courses now include Tableau as a key skill, as companies increasingly demand professionals who can transform raw data into meaningful insights.
In a world where data is the driving force behind decision-making, Tableau ensures that the insights you uncover are not just accurate—but also clear, impactful, and easy to act upon.
#data science course#top data science course online#top data science institute online#artificial intelligence course#deepseek#tableau
3 notes
·
View notes
Note
if you dont mind explaining, what is a power bi and how does it work?
Sure!
Power BI is basically Microsoft Excel if it were pretty and better at charts. It converts data from a database (or from Excel itself) into visualizations that are easy to filter and show other people what trends there are in the data. At the risk of sounding like a Power BI spokesman, I really like Power BI and I use it a lot for my job as an analyst because it makes it super easy to present managers with the information they need to make decisions, but there is a learning curve because there is somewhat of a coding language called DAX that you need to learn to get the most out of it. It's a free desktop download from Microsoft though with the base features, so if you ever wanted to try it out yourself you definitely can!
9 notes
·
View notes
Text
Best IT Courses In Bhubaneswar:- seeree services pvt ltd.
Introduction:- seeree is one of the best IT training institute and Software industry, features completely Industrial training on Python , PHP , .NET , C Programming,Java , IOT , AI , GD PI , ORACLE and ALL CERTIFICATION COURSES as well as provides seminar,cultural activity and jobs
Courses we provided:- 1) Java Fullstack 2) Python Fullstack 3) PHP Fullstack 4) Preplacement Training & Sp. Eng 5) .NET Fulstack 6) SEO/Digital Marketing 7) SAP 8) MERN 9) Software Testing 10)Data Analyst 11)Data Science 12)Data Engineering 13)PGDCA 14)Tally 15)Graphics Design
Course1:- Java Fullstack

A Class in Java is where we teach objects how to behave. Education at seeree means way to success. The way of teaching by corporate trainers will bloom your career. We have the best java training classes in Bhubaneswar. 100% Placement Support. Job Support Post Training. This course will give you a firm foundation in Java, commonly used programming language. Java technology is wide used currently. Java is a programming language and it is a platform. Hardware or software environment in which a program runs, known as a platform. Since Java has its own Runtime Environment (JRE) and API, it is called platform. Java programming language is designed to meet the challenges of application development in the context of heterogeneous, network-wide distributed environment. Java is an object-oriented programming (OOP) language that uses many common elements from other OOP languages, such as C++. Java is a complete platform for software development. Java is suitable for enterprise large scale applications.]
Course2:- Python Fullstack

Seeree offers best python course in Bhubaneswar with 100% job assurance and low fee. Learn from real time corporate trainers and experienced faculties. Groom your personality with our faculty. Seeree helps to build confidence in students to give exposure to their skills to the company.
Python is dynamically typed , compiled and interpreted , procedural and object oriented , generalized , general-purpose , platform independent programming language. Python is a high-level, structured, open-source programming language that can be used for a wide variety of programming tasks.
Course3:- PHP Fullstack

seeree is the best training institute which provide PHP Training courses in bhubaneswar and all over odisha We aim the students to learn and grow altogether with the need of IT firms.
PHP is a server scripting language, and a powerful tool for making dynamic and interactive Web pages. PHP is a widely-used, free, and efficient alternative to competitors such as Microsoft's ASP.
Course4:- Preplacement Training & Sp. Eng

Welcome to SEEREE Institute, where excellence meets opportunity. At SEEREE, we are dedicated to providing a transformative learning experience that empowers students to achieve their goals and contribute to a brighter future.
Our institute offers cutting-edge courses designed to meet the needs of the ever-evolving global landscape. With a team of highly qualified instructors and state-of-the-art facilities, we ensure a supportive and inspiring environment for learning and growth.
Whether you're here to develop new skills, explore innovative fields, or pursue personal and professional success, SEEREE Institute is the perfect place to begin your journey. Thank you for choosing us, and we look forward to being a part of your success story.
Course5:- .NET Fullstack

Seeree offers best .NET course in Bhubaneswar with 100% job assurance and low fee. Learn from real time corporate trainers and experienced faculties. Groom your personality with our faculty. Seeree helps to build confidence in students to give exposure to their skills to the company.
Course6:- SEO/Digital Marketing
In today's fast-paced digital world, businesses thrive on visibility, engagement, and strategic online presence. At SEEREE, we empower you with the skills and knowledge to master the art of Search Engine Optimization (SEO) and Digital Marketing.
Our comprehensive program is designed for beginners and professionals alike, covering everything from keyword research, on-page and off-page SEO, and content marketing, to social media strategies, PPC campaigns, and analytics.
With hands-on training, real-world projects, and guidance from industry experts, we ensure you're equipped to drive measurable results and excel in this dynamic field.
Join us at SEEREE Institute and take the first step towards becoming a leader in the digital marketing landscape!"
Course7:- SAP

SAP refers to Systems, Applications, and Products in Data Processing. Some of the most common subjects covered in these courses include human resource software administration, database management, and business training. Obtaining SAP certification can be done on a stand-alone basis or as part of a degree program.
Course8:- MERN

Seeree offers the best MERN course in Bhubaneswar with 100% job assurance and low fees. Learn from real-time corporate trainers and experienced faculty. Seeree helps students build confidence and gain skills to excel in company roles.
Are you ready to step into the exciting world of web development? At SEEREE, we bring you a comprehensive MERN Stack course that equips you with the skills to build modern, dynamic, and responsive web applications from start to finish.
The MERN Stack—comprising MongoDB, Express.js, React.js, and Node.js—is one of the most sought-after technologies in the web development industry. Our program is designed to help you master each component of the stack, from creating robust backends and managing databases to crafting dynamic frontends and seamless APIs.
Course9:- Software Testing

Seeree offers best Testing course in Bhubaneswar with 100% job assurance and low fee. Learn from real time corporate trainers and experienced faculties. Groom your personality with our faculty. Seeree helps to build confidence in students to give exposure to their skills to the company.
In the fast-paced world of software development, ensuring the quality and reliability of applications is crucial. At SEEREE, we offer a comprehensive Software Testing course designed to equip you with the skills and techniques needed to excel in this essential field.
Our program covers all aspects of software testing, from manual testing fundamentals to advanced automation tools and frameworks like Selenium, JIRA, and TestNG. You’ll learn to identify bugs, write test cases, execute test scripts, and ensure software meets high-quality standards.
With hands-on training, real-world scenarios, and guidance from experienced industry professionals, you’ll be prepared to take on roles like Quality Assurance Engineer, Test Analyst, and Automation Tester.
Join SEEREE Institute and gain the expertise to become a key player in delivering flawless software solutions. Your journey to a rewarding career in software testing starts here!"
Course10:- Data Analyst

Seeree offers the best Data Analyst course in Bhubaneswar with 100% job assurance and affordable fees. Our comprehensive curriculum is designed to cover all aspects of data analysis, from data collection and cleaning to advanced data visualization techniques. Learn from real-time corporate trainers and experienced faculty members who bring industry insights into the classroom. Enhance your analytical skills and boost your career prospects with hands-on projects and real-world case studies. Our faculty also focuses on grooming your personality and soft skills, ensuring you are well-prepared for interviews and workplace environments. Seeree is dedicated to building confidence in students, providing them with the necessary exposure to showcase their skills to top companies in the industry.
Course11:- Data Science

Seeree offers the best Data Science course in Bhubaneswar with 100% job assurance and affordable fees. Our comprehensive curriculum is designed to cover all aspects of data science, from data collection and cleaning to advanced data visualization techniques. Learn from real-time corporate trainers and experienced faculty members who bring industry insights into the classroom. Enhance your analytical skills and boost your career prospects with hands-on projects and real-world case studies. Our faculty also focuses on grooming your personality and soft skills, ensuring you are well-prepared for interviews and workplace environments. Seeree is dedicated to building confidence in students, providing them with the necessary exposure to showcase their skills to top companies in the industry.
Course12:- Data Engineering
In the era of big data, the ability to design, build, and manage scalable data infrastructure is one of the most in-demand skills in the tech industry. At SEEREE, we are proud to offer a comprehensive Data Engineering course that prepares you for a career at the forefront of data-driven innovation.
Our program covers essential topics such as data modeling, ETL processes, data warehousing, cloud platforms, and tools like Apache Spark, Kafka, and Hadoop. You’ll learn how to collect, organize, and transform raw data into actionable insights, enabling businesses to make smarter decisions.
With real-world projects, expert mentorship, and hands-on experience with the latest technologies, we ensure that you are industry-ready. Whether you’re starting fresh or upskilling, this program will empower you to unlock opportunities in the rapidly growing field of data engineering.
Join SEEREE Institute and take the first step toward building the data pipelines that power tomorrow’s technology!"
Course13:- PGDCA

Seeree offers the best MERN course in Bhubaneswar with 100% job assurance and low fees. Learn from real-time corporate trainers and experienced faculty. Seeree helps students build confidence and gain skills to excel in company roles.
In today’s digital age, computer applications are at the heart of every industry, driving innovation and efficiency. At SEEREE Institute, our Post Graduate Diploma in Computer Applications (PGDCA) program is designed to provide you with in-depth knowledge and hands-on skills to excel in the IT world.
This program offers a comprehensive curriculum covering programming languages, database management, web development, software engineering, networking, and more. Whether you aim to enhance your technical expertise or step into a rewarding career in IT, PGDCA at SEEREE equips you with the tools to succeed.
With expert faculty, state-of-the-art labs, and real-world projects, we ensure that you gain practical experience and a strong theoretical foundation. By the end of the program, you’ll be prepared for roles such as software developer, system analyst, IT manager, or database administrator.
Course14:- Tally

Seeree offers the best Tally course in Bhubaneswar with 100% job assurance and low fees. Learn from real-time corporate trainers and experienced faculty. Seeree helps students build confidence and gain skills to excel in company roles.
In today’s business world, efficient financial management is key to success, and Tally is one of the most trusted tools for accounting and financial operations. At SEEREE Institute, we offer a comprehensive Tally course designed to equip you with the skills needed to manage business finances effortlessly.
Our program covers everything from the basics of accounting and bookkeeping to advanced features like GST compliance, inventory management, payroll processing, and generating financial reports. With hands-on training and real-world applications, you’ll gain practical expertise in using Tally effectively for businesses of any scale.
Whether you're a student, a professional, or a business owner, our Tally program is tailored to meet your needs and enhance your career prospects in the fields of accounting and finance.
Course15:- Graphics Design

In the world of creativity and communication, graphic design plays a vital role in bringing ideas to life. At SEEREE Institute, our Graphic Design course is tailored to help you unlock your creative potential and master the art of visual storytelling.
Our program covers a wide range of topics, including design principles, color theory, typography, branding, and user interface design. You’ll gain hands-on experience with industry-standard tools like Adobe Photoshop, Illustrator, and InDesign, enabling you to create stunning visuals for print, digital media, and beyond.
Whether you're an aspiring designer or a professional looking to sharpen your skills, our expert trainers and real-world projects will provide you with the knowledge and confidence to excel in this competitive field.
Join SEEREE Institute and start your journey toward becoming a skilled graphic designer. Let’s design your future together!"
2 notes
·
View notes
Text
A TURN FROM B.Com OR BBA GRADUATE TO
DATA ANALYST

The business world is changing, and so are the opportunities within it. If you've finished your studies in Bachelor of Commerce (B.Com) or Bachelor of Business Administration (BBA), you might be wondering how to switch into the field of data analysis. Data analysts play an important role these days, finding useful information in data to help with decisions. In this blog post, we'll look at the steps you can take to smoothly change from a B.Com or BBA background to the exciting world of data analysis.
What You Already Know:
Even though it might feel like a big change, your studies in B.Com or BBA have given you useful skills. Your understanding of how businesses work, finances, and how organisations operate is a great base to start from.
Step 1: Building Strong Data Skills:
To make this change, you need to build a strong foundation in data skills. Begin by getting to know basic statistics, tools to show data visually, and programs to work with spreadsheets. These basic skills are like building blocks for learning about data.
I would like to suggest the best online platform where you can learn these skills. Lejhro bootcamp has courses that are easy to follow and won't cost too much.
Step 2: Learning Important Tools:
Data analysts use different tools to work with data. Learning how to use tools like Excel, SQL, and Python is really important. Excel is good for simple stuff, SQL helps you talk to databases, and Python is like a super tool that can do lots of things.
You can learn how to use these tools online too. Online bootcamp courses can help you get good at using them.
Step 3: Exploring Data Tricks:
Understanding how to work with data is the core of being a data analyst. Things like looking closely at data, testing ideas, figuring out relationships, and making models are all part of it. Don't worry, these sound fancy, but they're just different ways to use data.
Step 4: Making a Strong Collection:
A collection of things you've done, like projects, is called a portfolio. You can show this to others to prove what you can do. As you move from B.Com or BBA to data analysis, use your business knowledge to pick projects. For example, you could study how sales change, what customers do, or financial data.
Write down everything you do for these projects, like the problem, the steps you took, what tools you used, and what you found out. This collection will show others what you're capable of.
Step 5: Meeting People and Learning More:
Join online groups and communities where people talk about data analysis. This is a great way to meet other learners, professionals, and experts in the field. You can ask questions and talk about what you're learning.
LinkedIn is also a good place to meet people. Make a strong profile that shows your journey and what you can do. Follow data analysts and companies related to what you're interested in to stay up to date.
Step 6: Gaining Experience:
While you learn, it's also good to get some real experience. Look for internships, small jobs, or freelance work that lets you use your skills with real data. Even if the job isn't all about data, any experience with data is helpful.
Step 7: Updating Your Resume:
When you're ready to apply for data jobs, change your resume to show your journey. Talk about your B.Com or BBA studies, the skills you learned, the courses you took, your projects, and any experience you got. Explain how all of this makes you a great fit for a data job.
Using Lejhro Bootcamp:
When you're thinking about becoming a data analyst, think about using Lejhro Bootcamp. They have a special course just for people like you, who are switching from different fields. The Bootcamp teaches you practical things, has teachers who know what they're talking about, and helps you find a job later.
Moving from B.Com or BBA to a data analyst might seem big, but it's totally doable. With practice, learning, and real work, you can make the switch. Your knowledge about business mixed with data skills makes you a special candidate. So, get ready to learn, practice, and show the world what you can do in the world of data analysis!
***********
3 notes
·
View notes
Text
Power Up Your Career with Online Power BI Certification Training

In the data-driven world of today, the ability to transform data into actionable insights is a skill that holds immense value. Microsoft Power BI, a powerful business analytics tool, allows you to do just that. With the right training, you can become proficient in Power BI and take your career to new heights. This article introduces you to the world of Power BI and how online certification training can be a game-changer for your career.
The Significance of Microsoft Power BI
Unleashing Data Insights
Microsoft Power BI is a leading business intelligence and data visualization tool. It enables users to connect to various data sources, transform data, and create interactive, shareable dashboards and reports. With Power BI, you can unearth insights, make informed decisions, and drive business growth.
In-Demand Skill
As organizations increasingly rely on data-driven strategies, the demand for professionals who can harness the power of Power BI has surged. Companies across industries seek individuals with the ability to analyze data and communicate insights effectively. Therefore, learning Power BI is not just a career choice; it's a strategic move.
The Power of Online Certification Training
Online Learning Advantage
Online certification training offers a convenient and flexible way to acquire new skills. You can access high-quality training programs from the comfort of your home or office, allowing you to learn at your own pace. This flexibility is especially valuable for those with busy schedules.
Hands-On Experience
Effective learning requires practical experience. Quality online Power BI certification training includes hands-on exercises and real-world projects that enable you to apply your knowledge in a practical context. You won't just learn theory; you'll gain practical skills.
Expert Guidance
Certification courses are often created and taught by experts in the field. These instructors bring their real-world experience to the table, sharing insights, best practices, and industry trends. Learning from experts can fast-track your journey to becoming a Power BI pro.
What You'll Gain
Course Content
In a comprehensive Power BI certification course, you will explore various aspects of the tool, including:
1. Data Transformation
Learn how to connect to data sources, clean and transform data, and create data models. Data preparation is a critical step in the data analysis process.
2. Visualization
Discover the art of creating compelling visualizations. You'll understand how to design interactive reports and dashboards that effectively convey data insights.
3. Data Analysis
Master the techniques of data analysis. You'll be able to identify trends, anomalies, and correlations in data, enabling data-driven decision-making.
4. Power BI Service
Explore the features of the Power BI Service, which allows you to share and collaborate on reports and dashboards securely.
Elevate Your Career
Powering up your career with online Power BI certification training is a wise investment. As a certified Power BI professional, you'll be equipped with the skills and knowledge needed to excel in data analytics and visualization. You can pursue a variety of roles, such as Data Analyst, Business Intelligence Analyst, or Data Visualization Specialist. These roles offer not only competitive salaries but also the opportunity to influence business strategies and outcomes.
Don't miss the chance to take your career to the next level. Enroll in an online Power BI certification training program and unlock a world of opportunities. Elevate your career, seize data-driven success, and make a significant impact in the data-centric business landscape.
Source:- https://skillup.online/courses/microsoft-pl-300-power-bi-data-analyst/
2 notes
·
View notes
Text
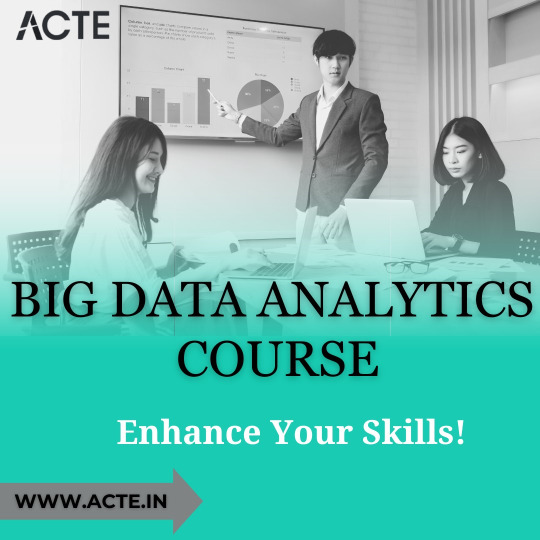
Cracking the Code: Explore the World of Big Data Analytics
Welcome to the amazing world of Big Data Analytics! In this comprehensive course, we will delve into the key components and complexities of this rapidly growing field. So, strap in and get ready to embark on a journey that will equip you with the essential knowledge and skills to excel in the realm of Big Data Analytics.
Key Components
Understanding Big Data
What is big data and why is it so significant in today's digital landscape?
Exploring the three dimensions of big data: volume, velocity, and variety.
Overview of the challenges and opportunities associated with managing and analyzing massive datasets.
Data Analytics Techniques
Introduction to various data analytics techniques, such as descriptive, predictive, and prescriptive analytics.
Unraveling the mysteries behind statistical analysis, data visualization, and pattern recognition.
Hands-on experience with popular analytics tools like Python, R, and SQL.
Machine Learning and Artificial Intelligence
Unleashing the potential of machine learning algorithms in extracting insights and making predictions from data.
Understanding the fundamentals of artificial intelligence and its role in automating data analytics processes.
Applications of machine learning and AI in real-world scenarios across various industries.

Reasons to Choose the Course
Comprehensive Curriculum
An in-depth curriculum designed to cover all facets of Big Data Analytics.
From the basics to advanced topics, we leave no stone unturned in building your expertise.
Practical exercises and real-world case studies to reinforce your learning experience.
Expert Instructors
Learn from industry experts who possess a wealth of experience in big data analytics.
Gain insights from their practical knowledge and benefit from their guidance and mentorship.
Industry-relevant examples and scenarios shared by the instructors to enhance your understanding.
Hands-on Approach
Dive into the world of big data analytics through hands-on exercises and projects.
Apply the concepts you learn to solve real-world data problems and gain invaluable practical skills.
Work with real datasets to get a taste of what it's like to be a professional in the field.
Placement Opportunities
Industry Demands and Prospects
Discover the ever-increasing demand for skilled big data professionals across industries.
Explore the vast range of career opportunities in data analytics, including data scientist, data engineer, and business intelligence analyst.
Understand how our comprehensive course can enhance your prospects of securing a job in this booming field.
Internship and Job Placement Assistance
By enrolling in our course, you gain access to internship and job placement assistance.
Benefit from our extensive network of industry connections to get your foot in the door.
Leverage our guidance and support in crafting a compelling resume and preparing for interviews.
Education and Duration
Mode of Learning
Choose between online, offline, or blended learning options to cater to your preferences and schedule.
Seamlessly access learning materials, lectures, and assignments through our user-friendly online platform.
Engage in interactive discussions and collaborations with instructors and fellow students.
Duration and Flexibility
Our course is designed to be flexible, allowing you to learn at your own pace.
Depending on your dedication and time commitment, you can complete the course in as little as six months.
Benefit from lifetime access to course materials and updates, ensuring your skills stay up-to-date.
By embarking on this comprehensive course at ACTE institute, you will unlock the door to the captivating world of Big Data Analytics. With a solid foundation in the key components, hands-on experience, and placement opportunities, you will be equipped to seize the vast career prospects that await you. So, take the leap and join us on this exciting journey as we unravel the mysteries and complexities of Big Data Analytics.
5 notes
·
View notes
Text

A career in management consulting can be both challenging and rewarding, as it involves helping organizations solve complex problems and improve their overall performance. Management consultants work with a wide range of clients, from large corporations to small businesses, non-profit organizations, and government agencies. If you're considering a career in management consulting, here are some key aspects to consider:
Roles and Responsibilities: Management consultants are hired to provide objective advice and expertise in various areas of business. Their responsibilities can include analyzing data, conducting research, developing strategies, implementing changes, and advising clients on organizational improvements. Consultants may specialize in different industries or functional areas such as strategy, operations, finance, human resources, IT, or marketing.
Qualifications and Skills: A strong educational background is often required for entry into management consulting. Most firms prefer candidates with at least a bachelor's degree, and many consultants hold advanced degrees (e.g., MBA, MSc, or Ph.D.). In addition to formal education, consultants need excellent analytical, problem-solving, and communication skills. They should be able to work well in teams and be adaptable to various working environments.
Industry Knowledge: Management consultants often need to understand specific industries and sectors they work in. Gaining expertise in a particular field can help you stand out and be more effective in your consulting engagements.
Consulting Firms: There are several well-known management consulting firms with global reach, such as McKinsey & Company, Boston Consulting Group (BCG), Bain & Company, Deloitte, PwC, EY, and others. These firms offer diverse opportunities for consultants to work on a wide range of projects and industries.
Travel and Work-Life Balance: Management consulting often involves travel, especially for client engagements. Depending on the firm and project, consultants may spend a significant amount of time on the road or at client sites. This can impact work-life balance, so it's essential to consider how much travel you are comfortable with.
Career Progression: A career in management consulting can offer a well-defined progression path. Consultants typically start as analysts or associates and can advance to senior consultant, manager, and ultimately, partner or director level. Alternatively, some consultants may choose to transition into industry roles after gaining experience.
Impact and Learning Opportunities: Management consultants have the opportunity to work on high-impact projects that can shape the future of organizations. The job also provides continuous learning opportunities as consultants tackle diverse challenges across various industries.
Demand and Job Market: The demand for management consultants can fluctuate based on the economic climate and the specific needs of industries. Consulting firms may go through periods of expansion or contraction, affecting job availability.
Entrepreneurial Opportunities: Experienced consultants may choose to start their consulting firms or join boutique consulting companies to focus on specific niches or industries.
Overall, a career in management consulting can be intellectually stimulating and provide exposure to various business environments. It's essential to research different firms, understand their areas of expertise, and network with professionals in the industry to make an informed decision about pursuing this career path.
Learn your career path in "Management Consulting" to achieve a 6 Figure Job 🤑 (even without any experience)
⚠️ATTENTION: JOIN THE FREE WORKSHOP NOW!!
JOIN 2 DAYS WORKSHOP FOR FREE
Click here to Register for free: https://go.jobaaj.com/Shubham-Agarwal
Join Us on Telegram for New Updates: https://t.me/jobaajlearnings
2 notes
·
View notes
Text
I recently explained to my lovable Mum that she can't just type in "beyonce songs" into youtube and every single song that Beyonce has ever sung will come up. That is not how internet searches work. With luck and using keywords and key phrased, she will probably get a lot of the songs she wants to hear. But by no means will she get a list of every single song that Beyonce has ever sung. She would have to go and find a website that lists those songs which she won't necessarily find if she searches for "website of all of beyonce songs". She might. But that's not the intention of the search.
It took some time but she finally understood.
This woman, a few years ago, did not know how to switch a computer on or off. But she is willing to learn. And I am so proud of her.
It is honestly a bit terrifying that we now have a generation of people who don't have the same things taught to them.
And I think it's hindering them.
No one taught me how to use SAP. But I just clicked on every single button on the program and before I knew it, I had gotten myself onto some really exciting projects at work because of my knowledge.
No one taught my analyst how to cleanse data in Excel. But she googled it, and taught herself how to use Excel functions, and now she is really respected for her Excel skills, and it is noticed by people at work.
These are just a few examples. I think this is something we honestly have to talk more about.
So this was originally a response to this post:
****

****
Which is about people wanting an AO3 app, but then it became large and way off topic, so here you go.
Nobody under the age of 20 knows how to use a computer or the internet. At all. They only know how to use apps. Their whole lives are in their phones or *maybe* a tablet/iPad if they're an artist. This is becoming a huge concern.
I'm a private tutor for middle- and high-school students, and since 2020 my business has been 100% virtual. Either the student's on a tablet, which comes with its own series of problems for screen-sharing and file access, or they're on mom's or dad's computer, and they have zero understanding of it.
They also don't know what the internet is, or even the absolute basics of how it works. You might not think that's an important thing to know, but stick with me.
Last week I accepted a new student. The first session is always about the tech -- I tell them this in advance, that they'll have to set up a few things, but once we're set up, we'll be good to go. They all say the same thing -- it won't be a problem because they're so "online" that they get technology easily.
I never laugh in their faces, but it's always a close thing. Because they are expecting an app. They are not expecting to be shown how little they actually know about tech.
I must say up front: this story is not an outlier. This is *every* student during their first session with me. Every single one. I go through this with each of them because most of them learn more, and more solidly, via discussion and discovery rather than direct instruction.
Once she logged in, I asked her to click on the icon for screen-sharing. I described the icon, then started with "Okay, move your mouse to the bottom right corner of the screen." She did the thing that those of us who are old enough to remember the beginnings of widespread home computers remember - picked up the mouse and moved it and then put it down. I explained she had to pull the mouse along the surface, and then click on the icon. She found this cumbersome. I asked if she was on a laptop or desktop computer. She didn't know what I meant. I asked if the computer screen was connected to the keyboard as one piece of machinery that you can open and close, or if there was a monitor - like a TV - and the keyboard was connected to another machine either by cord or by Bluetooth. Once we figured it out was a laptop, I asked her if she could use the touchpad, because it's similar (though not equivalent) to a phone screen in terms of touching clicking and dragging.
Once we got her using the touchpad, we tried screen-sharing again. We got it working, to an extent, but she was having trouble with... lots of things. I asked if she could email me a download or a photo of her homework instead, and we could both have a copy, and talk through it rather than put it on the screen, and we'd worry about learning more tech another day. She said she tried, but her email blocked her from sending anything to me.
This is because the only email address she has is for school, and she never uses email for any other purpose. I asked if her mom or dad could email it to me. They weren't home.
(Re: school email that blocks any emails not whitelisted by the school: that's great for kids as are all parental controls for young ones, but 16-year-olds really should be getting used to using an email that belongs to them, not an institution.)
I asked if the homework was on a paper handout, or in a book, or on the computer. She said it was on the computer. Great! I asked her where it was saved. She didn't know. I asked her to search for the name of the file. She said she already did that and now it was on her screen. Then, she said to me: "You can just search for it yourself - it's Chapter 5, page 11."
This is because homework is on the school's website, in her math class's homework section, which is where she searched. For her, that was "searching the internet."
Her concepts of "on my computer" "on the internet" or "on my school's website" are all the same thing. If something is displayed on the monitor, it's "on the internet" and "on my phone/tablet/computer" and "on the school's website."
She doesn't understand "upload" or "download," because she does her homework on the school's website and hits a "submit" button when she's done. I asked her how she shares photos and stuff with friends; she said she posts to Snapchat or TikTok, or she AirDrops. (She said she sometimes uses Insta, though she said Insta is more "for old people"). So in her world, there's a button for "post" or "share," and that's how you put things on "the internet".
She doesn't know how it works. None of it. And she doesn't know how to use it, either.
Also, none of them can type. Not a one. They don't want to learn how, because "everything is on my phone."
And you know, maybe that's where we're headed. Maybe one day, everything will be on "my phone" and computers as we know them will be a thing of the past. But for the time being, they're not. Students need to learn how to use computers. They need to learn how to type. No one is telling them this, because people think teenagers are "digital natives." And to an extent, they are, but the definition of that has changed radically in the last 20-30 years. Today it means "everything is on my phone."
50K notes
·
View notes
Text
Microsoft Visio and Microsoft Visual Studio: Essential Tools for Business and Development
Technology has transformed the way professionals visualize data and develop software. Two key tools that continue to empower users in different domains are Microsoft Visio and Microsoft Visual Studio. Both are designed to improve productivity, simplify tasks, and bring clarity to complex information.
Whether you're building enterprise-level software or creating process diagrams, these tools serve critical purposes. Let’s explore how each tool works and how they benefit both individuals and organizations.
What Makes Microsoft Visio Unique?
Microsoft Visio is widely used by project managers, IT professionals, and business analysts. It allows users to create flowcharts, network diagrams, organizational charts, and more.
Unlike traditional drawing tools, Visio offers templates and smart shapes. These features help you design diagrams with precision and speed. The drag-and-drop interface is easy to use, even for beginners.
You can also link your diagrams to real-time data from Excel or SQL servers. This feature lets you visualize current data, making your charts more meaningful.
The Advantages of Using Microsoft Visio
There are several reasons professionals rely on Visio. Here are the top benefits:
Real-Time Collaboration: You can work on diagrams with your team through Microsoft 365 integration.
Data-Linked Diagrams: Charts can be linked to live data, offering instant insights.
Automation: Visio allows automatic updates in diagrams when the source data changes.
Versatility: It supports different types of diagrams, from business models to IT architecture.
Using Microsoft Visio not only saves time but also helps you present ideas clearly.
Microsoft Visual Studio: The Developer’s Toolbox
Microsoft Visual Studio is a powerful Integrated Development Environment (IDE). It's used by millions of software developers worldwide.
Visual Studio supports various programming languages, including C#, Python, JavaScript, and C++. It also provides a built-in debugger, source control tools, and intelligent code completion.
What sets Visual Studio apart is its flexibility. You can develop web apps, mobile apps, and desktop software using one single platform.
Features That Make Microsoft Visual Studio Indispensable
Here are some standout features of Microsoft Visual Studio:
Code Refactoring: The IDE suggests changes to improve code readability and performance.
Live Debugging: You can test and fix code while your app is running.
Git Integration: Visual Studio has built-in Git tools for version control.
Cloud Connectivity: Easily deploy apps to Azure and integrate cloud-based services.
With these tools, developers can work faster and write more reliable code.
Microsoft Visio vs Traditional Diagram Tools
Why choose Microsoft Visio over free tools? The answer lies in accuracy and scalability.
Basic tools may help with simple flowcharts. But Visio is ideal for professionals who need precise, data-driven diagrams. Its features reduce manual tasks and errors.
You can also integrate Visio with tools like Power BI, SharePoint, and Microsoft Teams. This makes it easier to collaborate and share insights.
If you manage processes, networks, or structures, Visio delivers a much better experience.
Subheading: Microsoft Visual Studio for All Skill Levels
Beginners and advanced developers alike benefit from using Microsoft Visual Studio.
For beginners, it offers guided development. Templates and code suggestions help you learn best practices. There’s also extensive documentation and community support.
For experienced developers, the advanced debugging tools and language support make coding efficient. You can also customize your environment with plugins and extensions.
No matter your level, Microsoft Visual Studio provides a smooth development workflow.
Why Businesses Should Invest in Microsoft Visio
Visual data improves understanding and decision-making. That’s why many businesses use Microsoft Visio to communicate ideas clearly.
From HR to IT departments, every team can benefit. For example, HR can design org charts. The IT team can map network structures. Marketing teams can visualize customer journeys.
Visio’s visualizations make complex data easier to digest. That leads to better team collaboration and faster decision-making.
Integrating Microsoft Visual Studio into Your Workflow
Adding Microsoft Visual Studio to your workflow can boost development speed and code quality.
It works well with tools like Azure DevOps, GitHub, and Docker. This means your development cycle becomes more efficient. You can push updates faster and catch bugs early.
For companies that build and maintain software products, Visual Studio is not optional—it’s essential.
Which Microsoft Tool Is Right for You?
Both Microsoft Visio and Microsoft Visual Studio serve distinct roles.
Choose Visio if you need to:
Create professional diagrams
Present data visually
Improve team collaboration through charts
Choose Visual Studio if you:
Develop software
Need integrated tools for coding and testing
Want cloud and version control support
They aren’t mutually exclusive. Many teams use both tools together to manage operations and development.
Final Thoughts: Empower Your Work with Microsoft Tools
In today’s fast-moving world, clarity and efficiency matter. Tools like Microsoft Visio and Microsoft Visual Studio help teams stay productive, organized, and ahead of the competition.
If you want to improve your workflows and achieve better results, these tools are worth the investment. Each brings powerful capabilities to the table—Visio for visualization, and Visual Studio for software creation.
Start using them today and unlock the full potential of your team and projects.
0 notes
Text
How Long Does It Take to Complete a Certificate in Python Programming?

Introduction
Python is often called the "beginner’s language," but that doesn’t mean it’s only for beginners. It’s versatile, in-demand, and powers everything from web development to data science. But if you're aiming to build a career or gain skills fast, the big question is: How long does it take to complete a certificate in Python programming? The answer depends on your goals, the course format, and your learning pace. Whether you choose a part-time or intensive track, a Python certification course online offers flexibility and structured learning to suit every schedule. In this blog, we’ll break down the typical timelines, factors affecting course duration, and how Python online training with certification can speed up your path to professional programming skills faster than you might expect.
Why Pursue a Python Certificate?
Before we dive into timelines, it’s important to understand the value of a Python certificate.
Skill Validation: Certificates validate your skills to employers.
Career Switch: Many professionals use it to pivot into tech roles.
Freelancing & Projects: A certificate can help you land freelance work.
Academic Credit: Some certificates are recognized in higher education.
Python online training with certification offers flexibility, practical experience, and job readiness.
Average Time to Complete Python Certification Courses
Let’s explore average timeframes based on course type:
1. Beginner-Level Courses (4 to 6 Weeks)
Target Audience: Absolute beginners
Course Load: 3–5 hours/week
Topics: Syntax, variables, loops, functions, error handling
Outcome: Able to write basic scripts
Certificate: Completion certificate or entry-level credential
2. Intermediate Courses (2 to 3 Months)
Target Audience: Learners with basic Python knowledge
Course Load: 5–8 hours/week
Topics: Object-Oriented Programming, modules, file handling, APIs
Outcome: Build medium-level projects like a web scraper or calculator
Certificate: Industry-recognized Python certification online
3. Advanced or Career-Focused Programs (3 to 6 Months)
Target Audience: Career changers or professionals
Course Load: 8–12 hours/week
Topics: Data structures, algorithms, Flask/Django, Pandas, NumPy
Outcome: Portfolio projects, job readiness
Certificate: Professional Python online course certification
Factors That Influence Course Completion Time
Many elements influence how fast you can finish a Python certification program:
a) Learning Mode
Self-Paced: Flexible but requires self-discipline; ideal for working professionals
Instructor-Led: Structured and faster; includes live mentorship
b) Learning Goals
Want to build one project? You might need just 4 weeks.
Want job readiness? Plan for 3–6 months.
c) Time Commitment
Part-Time (5 hours/week): Good for balancing work
Full-Time (20+ hours/week): Ideal for career switchers
d) Course Content and Depth
A basic course with only videos takes less time than a hands-on course with real-world projects. While video-based learning can provide quick theoretical knowledge, it often lacks the depth needed to build strong, practical skills. Learners may grasp the concepts but struggle to apply them in real scenarios. On the other hand, a hands-on course that includes projects, coding exercises, and real-time feedback fosters deeper understanding and confidence. This is especially true when you opt for a python online course certification that emphasizes experiential learning. Such courses may take longer, but they better prepare you for job roles and industry expectations.
e) Your Background
Already know basic coding? You’ll move faster.
Complete beginner? Plan extra time for fundamentals.
Real-World Timelines: Case Studies
Case Study 1: Ramesh, 25, Graduate Student
Background: No coding experience
Course: Python for Beginners
Time to Completion: 6 weeks
Outcome: Able to automate Excel tasks and build small scripts
Case Study 2: Priya, 32, Data Analyst
Background: Basic Python knowledge
Course: Python for Data Science (edX + Project Work)
Time to Completion: 3 months (8 hours/week)
Outcome: Built a data dashboard and landed a promotion
Case Study 3: Arjun, 28, Career Switcher
Background: Mechanical engineer
Course: Full Python Developer Bootcamp (certification + Projects)
Time to Completion: 5 months
Outcome: Freelancing in automation and web scraping
Python Online Training with Certification: Why It’s Efficient
When it comes to flexible yet rigorous learning, Python online training with certification is ideal. Here's why:
1. Flexible Scheduling
Learn at your own pace
Perfect for part-time learners
2. Practical Projects
Work on mini projects like:
Web scraper
Chatbot
Data visualizations
3. Hands-On Skill Development
Real code > watching videos
Immediate feedback in coding exercises
4. Industry Recognition
Recognized certificates help during job applications
Often include GitHub-ready project portfolios
5. Support & Community
Forums, live doubt-clearing sessions, peer interaction
Sample Weekly Schedule for a 3-Month Python Certification Online Program
Week
Topics Covered
Outcome
1–2
Python Basics, Data Types, Loops
Write basic scripts
3–4
Functions, Error Handling
Modular programming
5–6
File I/O, APIs
Fetch and analyze data
7–8
OOP, Modules
Create structured programs
9–10
Web Development (Flask)
Deploy a web app
11–12
Capstone Project
Final project + GitHub upload
How to Choose the Right Course Based on Duration
1. Short-Term (4–6 Weeks)
Great for: Beginners or hobbyists
Example: Codecademy’s Python Track
2. Mid-Term (2–3 Months)
Great for: Upskilling professionals
Example: Google’s Python Crash Course
3. Long-Term (3–6 Months)
Great for: Career switchers
Example: Python online course certification with live projects and career support
FAQs: Python Certification Duration
Q1. Can I finish a Python course in one month?
Yes, beginner-level or crash courses can be completed in 4 weeks with focused effort.
Q2. What if I can’t stick to a fixed schedule?
Choose a self-paced Python certification online. Flexibility is key.
Q3. How long does it take to become job-ready?
Generally, 3 to 6 months with a structured course including projects and mock interviews.
Key Takeaways
A Python certificate can take anywhere from 4 weeks to 6 months.
Self-paced options allow flexibility, while instructor-led programs offer structure.
Your learning background, goals, and available time will influence the pace.
Opt for Python online training with certification for hands-on, job-focused learning.
Conclusion
Python programming skills can be your gateway to tech. Whether you aim for automation, data science, or web development, a certificate helps you showcase your learning. Start your journey today with Python online training with certification and unlock real career opportunities.
With Python being one of the most in-demand programming languages, gaining hands-on experience backed by a valid credential can give you an edge in the competitive job market. A structured course not only teaches syntax and logic but also sharpens your problem-solving skills through real-world projects. Enrolling in a python certification online course ensures you're learning from industry-aligned curriculum, guided by expert mentors, and preparing yourself for roles like Python developer, data analyst, or automation tester.
0 notes
Text
India’s Leading MBA Colleges for Marketing – Here’s Why GLA Mathura Shines

In today's competitive business world, marketing professionals are no longer just brand builders – they are strategic thinkers, data-driven decision-makers, and digital trendsetters. If you're planning to build a future in marketing, choosing the right B-school is your first and most important step. Among the top MBA colleges for marketing in India, GLA University Mathura, is emerging as a powerhouse of innovation, industry exposure, and academic excellence.
Let’s explore why GLA Mathura is among the best colleges for MBA in marketing and how it can shape your journey into the ever-evolving world of business.
The Growing Relevance of MBA in Marketing Management
An MBA in Marketing Management prepares students to understand customer behavior, build strong brand strategies, and drive business growth through creative campaigns, digital media, and analytics. From FMCG to fintech, startups to multinational corporations – marketing professionals are in demand across all industries.
And when combined with finance, students who pursue MBA in Finance and Marketing gain a competitive edge by understanding not just how to market products but also how to manage budgets, profitability, and ROI — essential skills for modern marketers.
Why GLA Mathura is a Top Choice
1. Industry-Aligned Curriculum
GLA Mathura's MBA program is tailored to meet the dynamic demands of the business world. The MBA in Marketing Management here integrates classic marketing theories with the latest in digital marketing, consumer analytics, branding, and market research. Specialized courses in MBA in Finance and Marketing further enhance business acumen by blending financial strategy with promotional intelligence.
2. Top-Notch Faculty
GLA University brings together experienced academicians and industry professionals who provide both theoretical grounding and practical insights. Regular guest lectures, case studies, and interactive sessions ensure students get a real-world perspective on modern marketing challenges.
3. Outstanding Placement Support
As a premier MBA college in UP, GLA Mathura has built strong ties with top recruiters across sectors. From marketing analyst roles to brand manager and digital strategist positions, students are placed in well-paying jobs with respected organizations. Companies like HDFC Bank, Infosys, Byju’s, and Godrej frequently recruit from GLA.
4. Hands-on Learning and Internships
GLA strongly believes in experiential learning. Through summer internships, live marketing projects, market research assignments, and brand simulation activities, students gain practical experience that makes them job-ready from day one.
GLA’s Unique Advantages Over Other MBA Colleges
Specialized Marketing Labs: Equipped with tools and software used by real-world marketing professionals.
Digital Marketing Certification: Students receive training in SEO, Google Ads, social media strategy, and more.
Entrepreneurship Support: Aspiring marketers and business owners are supported by the university’s incubation cell.
Global Exposure: International collaborations and seminars offer students a global perspective on marketing trends.
This holistic development approach places GLA Mathura confidently among the top MBA colleges for marketing in India.
Student Testimonials
“GLA’s MBA program transformed my confidence. From classroom projects to working with live clients, I gained real skills that helped me land my dream job in brand management.” — Aayushi Sharma, MBA (Marketing) Graduate, 2023
Choosing the right college can define your entire career. If you're searching for an MBA college in UP that offers quality education, hands-on experience, strong placements, and a focus on modern marketing tools, GLA University, Mathura, should be at the top of your list.
Whether your interest lies in MBA in marketing management, MBA in finance and marketing, or you simply want to be part of one of the best colleges for MBA in marketing in India, GLA delivers everything you need to succeed.
Admissions are now open! Take the next big step toward your dream career in marketing – Choose GLA University, where ambition meets opportunity.
0 notes
Text
How an "Best Data Analyst Course" Can Secure Your Job in the Evolving 2025-2026 Market, 100% Job in MNC, Excel, VBA, SQL, Power BI, Tableau Projects, "Best Data Analyst Course" in Delhi, 110089 - Free Alteryx, Python Data Science Certification, By SLA Consultants India,
A “Best Data Analyst Course” is a powerful tool to secure your job in the rapidly evolving 2025-2026 market, especially as demand for skilled data analysts continues to surge across industries. The US Bureau of Labor Statistics projects a 23% increase in data analyst jobs by 2032, with entry-level salaries now at $90,000—a $20,000 jump from 2024—and average salaries reaching $111,000, reflecting the high value organizations place on analytical expertise. In India, the data analytics sector is projected to reach $118.7 billion by 2026, highlighting a wealth of opportunities for those with the right skills.
Data Analyst Course in Delhi
Employers are seeking candidates with a robust skill set that includes proficiency in Excel, VBA, SQL, Power BI, and Tableau—tools that are consistently referenced in job postings and essential for data manipulation, automation, and visualization. Advanced skills in automation (Alteryx) and programming (Python) are also increasingly valued, as companies integrate AI and machine learning into their workflows. While AI is transforming the field by automating routine tasks, it is not replacing data analysts; instead, it is augmenting their work and increasing their strategic value. In fact, 70% of analysts say AI automation enhances their effectiveness, while 87% feel more strategically valuable than ever before. This means that professionals who can leverage both traditional and cutting-edge tools will be in high demand.
A Data Analyst Training Course in Delhi offered by SLA Consultants India in Delhi (110089) is specifically designed to prepare you for this dynamic market. The comprehensive curriculum covers all essential tools—Excel, VBA, SQL, Power BI, Tableau—and includes real-world projects that simulate the challenges faced by analysts in leading organizations. The inclusion of free Alteryx and Python Data Science certification further enhances your profile, equipping you with advanced analytics and automation skills that are highly sought after by employers. This practical, hands-on approach ensures you are job-ready and can demonstrate your ability to deliver actionable insights from complex data.
Data Analyst Training Course Modules Module 1 - Basic and Advanced Excel With Dashboard and Excel Analytics Module 2 - VBA / Macros - Automation Reporting, User Form and Dashboard Module 3 - SQL and MS Access - Data Manipulation, Queries, Scripts and Server Connection - MIS and Data Analytics Module 4 - MS Power BI | Tableau Both BI & Data Visualization Module 5 - Free Python Data Science | Alteryx/ R Programing Module 6 - Python Data Science and Machine Learning - 100% Free in Offer - by IIT/NIT Alumni Trainer
With robust placement support and 100% job guarantee for MNCs, SLA Consultants India’s Data Analyst Certification Course in Delhi provides a clear pathway to high-paying roles in top organizations, both locally and internationally. The flexibility to work remotely or in hybrid environments further expands your opportunities, as data analyst roles are among the most sought-after remote jobs globally. By investing in this certification, you position yourself for rapid career advancement and financial success, securing your place in the evolving, data-driven economy of 2025-2026. The combination of strong technical skills, business acumen, and the ability to adapt to new technologies makes data analyst professionals indispensable and ensures their continued high demand across industries. For more details Call: +91-8700575874 or Email: [email protected]
0 notes